CHECK OUT OUR NEW P&L EXTENSION for QLIK SENSE
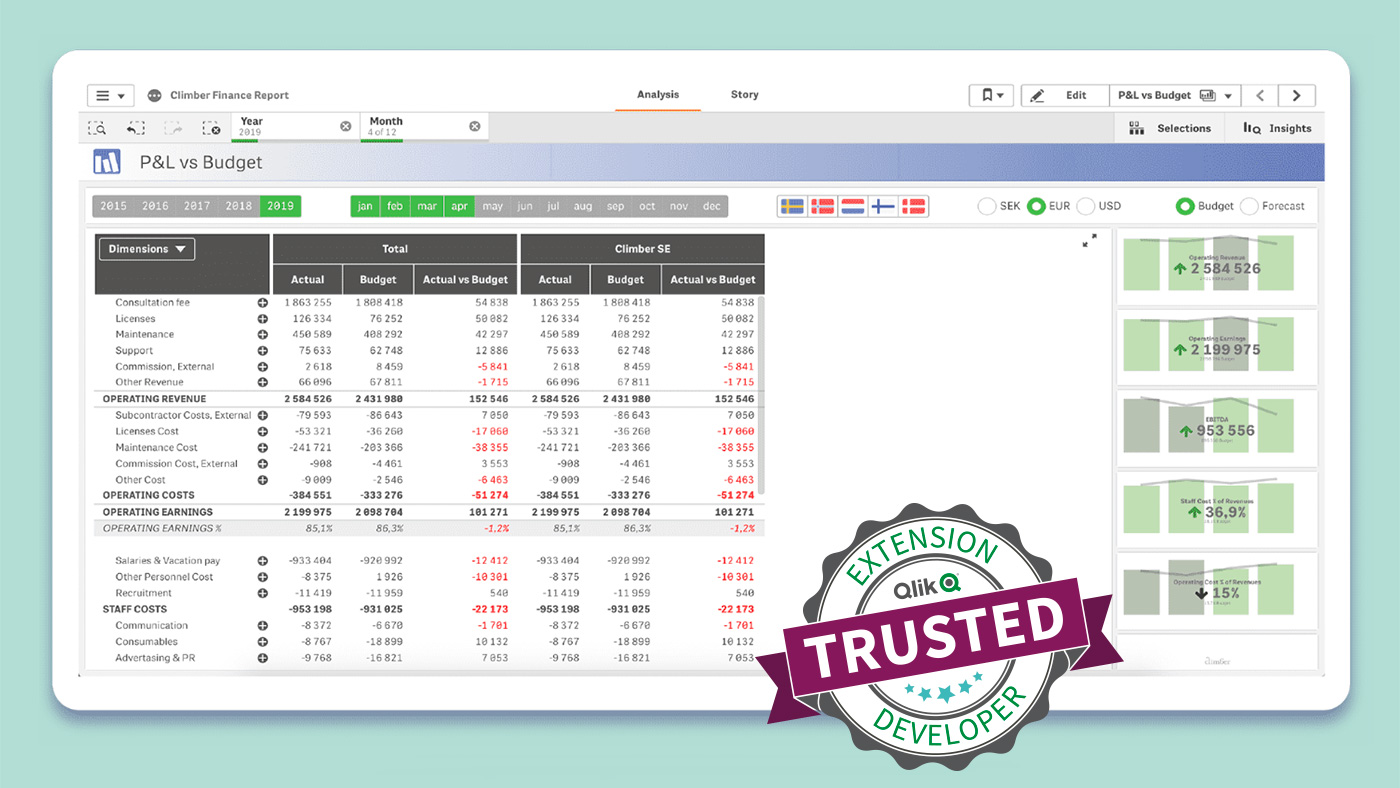
The P&L statement is the go-to report for getting a high-level view of a business’s finances. Think of it as a health report card for your business. And one in real-time, with a more professional, attractive, key-info-at-a-glance look & feel, will make your CFO even happier. We are stoked to be launching the Climber P&L Extension, today referred to as the Vizlib Finance Report, for Qlik Sense, an easy-to-use, flexible solution that will make your P&L reporting much faster and more informative. The extension adds the P&L to your BI solution, making it easier to analyze your P&L, and drill-down to details, while connecting it to your overall operations. The base for the extension is a regular pivot table, which also accommodates balance sheets and other formatted tables. Check out the tutorial above to see how it works! If you are interested in trying the extension or adding it to your Qlik Sense Solution just contact us to learn more.
CHANGE DIMENSIONS,
DRILL-DOWN AND EXPORT
Our new P&L extension is based on a regular pivot table, allowing you to use either a top dimension or group the expressions together. You can also use drill-down dimensions and make selections by simply clicking on a row. Likewise, the extension allows you to:

- Use alternative dimensions for both the first, the sub-row and the top dimension. You can also use different P&L setups and switch between time periods.
- Include KPI-rows to give the user an easy indication of, for example, percentage of operating income.
- Right-click to export the P&L to Excel, while keeping the same formatting.
- Add comments and create a reporting hierarchy using the Climber Comments Extension, which the extension stores in a database, making possible to see who created each comment and when. For example, business units can comment on their numbers, country managers can add their input and everything is combined at a corporate level.


Enabling Predictive Analytics to the people
Vizlib shortening time form data to action
Join us for an online masterclass on how to accelerate actions through Augmented Data Analytics at the Qlik Analytics Tour 2020 on September 17th, 10 am CET!
Our friends at Vizlib will showcase how any user can leverage advanced analytics on the fly to predict the best action to follow up, with the help of smart visualisations, clustering and collaboration in Qlik Sense. The event is free, and spots are limited.

Want a demo of the P&L extension for Qlik Sense? Contact us!
In 2019, Vizlib acquired all Climber Extensions and continue to expand the value-added capabilities as part of their wider product offering for Qlik Sense. Please get in touch if you want a demo of the P&L or want more information about any of our Qlik Sense extensions.
BUY THE P&L EXTENSION FROM VIZLIB VIA CLIMBER
Vizlib builds powerful value-adding extension products for Qlik Sense. Climber is reselling Vizlib in the UK, Finland, and the Netherlands and is the main reseller Sweden. Together, we offer a complete range of functions and visualisations that fulfil your expectations and the needs of your company. Contact us to learn more, book a demo or subscribe!

News archive

The Data Literacy Imperative – Why your business can’t afford to ignore it
A recent Gartner report ranks poor data literacy among the top five barriers to the success of data and analytics initiatives. Discover strategies to bridge the data literacy gap and empower your team to make informed, data-driven decisions.
>> Read more
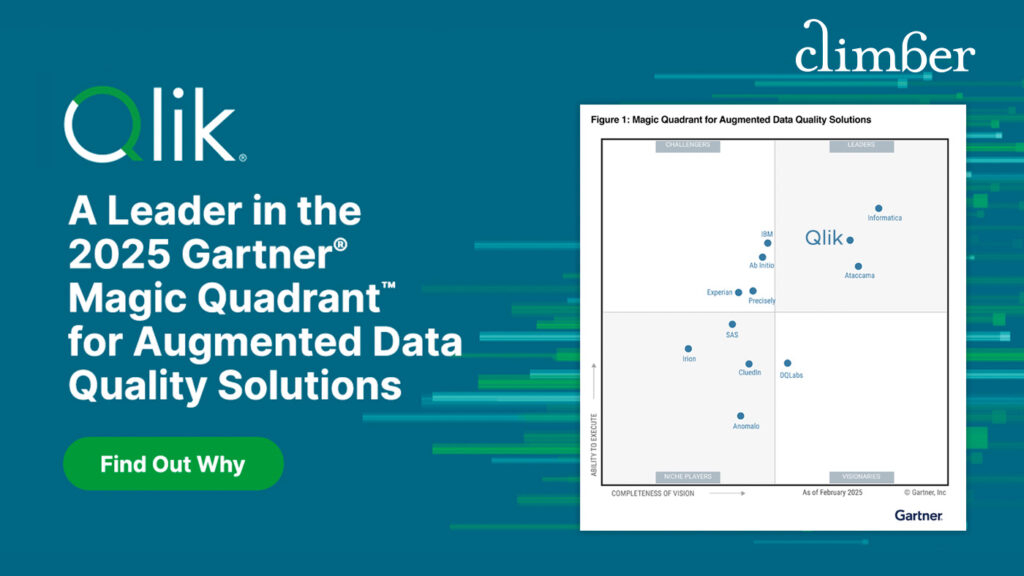
Qlik a Leader in the 2025 Gartner Magic Quadrant for Augmented Data Quality Solutions
Gartner has published the 2025 Magic Quadrant for Augmented Data Quality Solutions. After evaluating 12 top vendors, they have once again named Qlik a Leader—marking the sixth time!
>> Download the report
Breaking Data Silos: How to Build a Modern and AI-ready Data Platform with Qlik Talend Cloud
Want to be able to respond faster to business challenges and foster a data-driven culture? Then join this webinar to learn how Qlik Talend Cloud can help you reduce the complexity of your data architecture.
>> Register now!
